At the time of writing ATOM is being traded at the price of $34.54. The price has decreased by a value of 0.70% in the past 24 hours. ATOM is listed on the 26th spot in coinmarketcap. It has a market dominance of 0.29%. The volume has increased by just 9.28% in the past 24 hours.
Top 5 Tech Stocks to Buy in 2024
Don't let the chaos of rising interest rates, potential recession, tighter credit issues, higher oil prices, and incessant geopolitical issues chase you from the markets. Instead, just wait it out. With too much fear in the market, go bargain hunting with tech stocks. We have complied a report with the five of the best ways to profit within this industry.
"Top 5 AI Stocks to Buy in 2024."
Click here to sign up for our free report & newsletter, plus bonus offer "Elon Musk just Tiggered a BOOM in These Stocks"
Sponsored
Technical Analysis:
Atom has recently made its new all time high last month. Afterwards, the price now seems to be in a corrective phase which favors sells
Starting from the monthly, previous two months seems to be very much bullish. The amount of bulls is enormous which makes the momentum to the upside quite strong. But as being in the second quarter of month, bulls doesn’t seems to be interesting in driving price more higher. rather its getting rejected and it is still a bearish candle on monthly.
Taking a look at the weekly time frame, ATOM seems to have been much extended to the upside, which makes it sort of unhealthy for the market. As being in the premium zone, sells are preferred so weekly gives shows bearish sentiment at the moment as well.
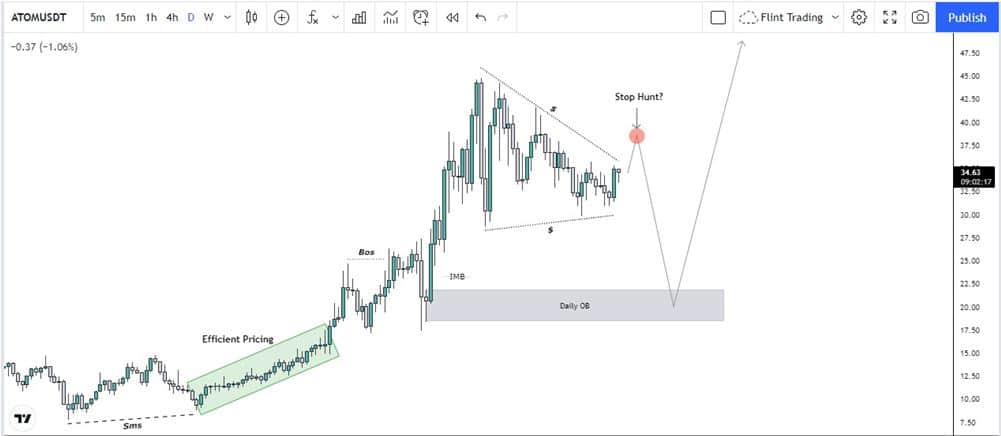
Now on daily, ATOM did a shift in market structure on 20th July 2021, the price being very efficient started moving upside breaking structure and creating demand zones. Now the major one among these was a rally base rally, a demand pattern which is still intact, haven’t tested and unmitigated at the moment.

Now recently, as mentioned on higher time frame, ATOM is rejecting, which on smaller scale shows a descending wedge pattern. Now being with this, the market is creating liquidity to both top and downside which sooner or later might get grabbed. As being imbalance and an unmitigated demand zone present below, it is quite likely that price will come to these areas. But understanding the mass psychology, the price may fake out the upside, grabbing liquidity and inducing breakout buyers which too may get grabbed once the bear phase in fake out starts. The move may end in the demand zone or in imbalance zone, depending where it shows structure shifts.
From these either zones, a push can be expected so these can be considered as the target. Now regarding this fake out move, one thing to see is that at the moment, bitcoin is pumping quite momentously which can pump these coins as well, so that may be a reason for this fake out to occur. An invalidation point will be, if in case, the price jumps over its all time high, that way sells won’t be preferred as the second leg of pole flag can be expected.


