Ethereum Classic (ETC) had created its All Time High in May 2021 and reached a price of almost $179.83 before rejecting down to a price of almost $32.21 by losing much percentage of its value. At the time of writing this article ETC is being traded at a price of $56.71 with an increase of 2.23% in the last 24 hours. In the past 24 hours, the volume has increased by 71.27% creating the overall trading volume to $1,614,406,282. The circulating supply is around 130,359,735.34 ETC. It is listed at 28 on coinmarketcap with a dominance of 0.29%
Top 5 Tech Stocks to Buy in 2024
Don't let the chaos of rising interest rates, potential recession, tighter credit issues, higher oil prices, and incessant geopolitical issues chase you from the markets. Instead, just wait it out. With too much fear in the market, go bargain hunting with tech stocks. We have complied a report with the five of the best ways to profit within this industry.
"Top 5 AI Stocks to Buy in 2024."
Click here to sign up for our free report & newsletter, plus bonus offer "Elon Musk just Tiggered a BOOM in These Stocks"
Sponsored
The top exchanges for trading in Ethereum Classic are currently Binance, Huobi Global, OKEx, Mandala Exchange, and FTX
Technical Analysis:
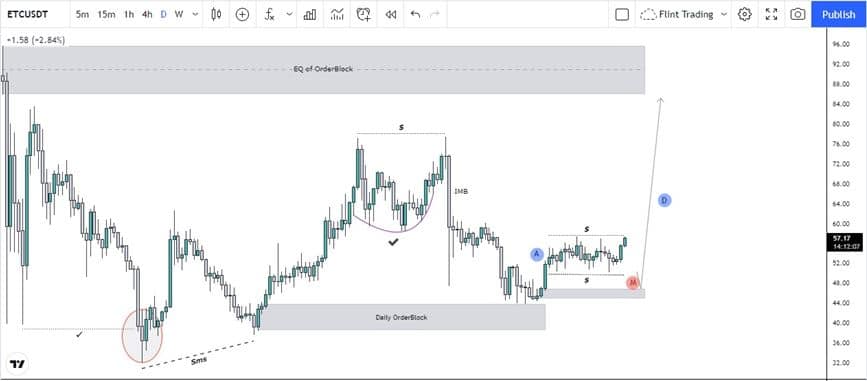
ETC on monthly timeframe is actually showing nothing special, just a large wick, and a consolidation which can turn out to be re accumulation or distribution depending which side it shows its interest. Jumping to the weekly, the price seems to be doing an Elliot corrective move which may turn out the next move to the upside. Moving to the daily time frame, as always price has much to show on this time frame, as this shows recent price action.
Price once it made its all-time high, started breaking structure to the downside. Within this move on the 18th of May 2021, the price moved very aggressively to the downside, which shows the involvement of bigger institutions.
This created a drop base drop pattern from where the price may react in the future sooner or later. Afterwards ETC continued pushing down until 22nd of June 2021, when price didn’t broke structure aggressively, rather did a stop hunt of previous low, which resulted in a shift in market structure. after wards price did moved efficiently to the upside leaving no gaps in the way, but the origin of this move could have been considered as an order block, as this was the candle which originated this move which broke the previous structure.

This move lasted below the previously mentioned supply zone and made a double top and started to fell again. Now, this is more like a bread and butter setup, as just before tapping a supply zone or orderblock, market engineers liquidity. the price fell down, tapped in the below orderblock, and showed a reaction. and soon after the reaction, the price has now been in consolidation.
This consolidation, it is likely that ETC on a bigger scale will continue to the upside, but there’s also a probability that an AMD pattern might unfold in here as just below there’s an unmitigated zone which might get mitigated with a manipulation phase of AMD. The original distribution or expansion phase can be expected to the upside that might clear liquidity, fill the imbalance, and tap in the supply zone eventually

