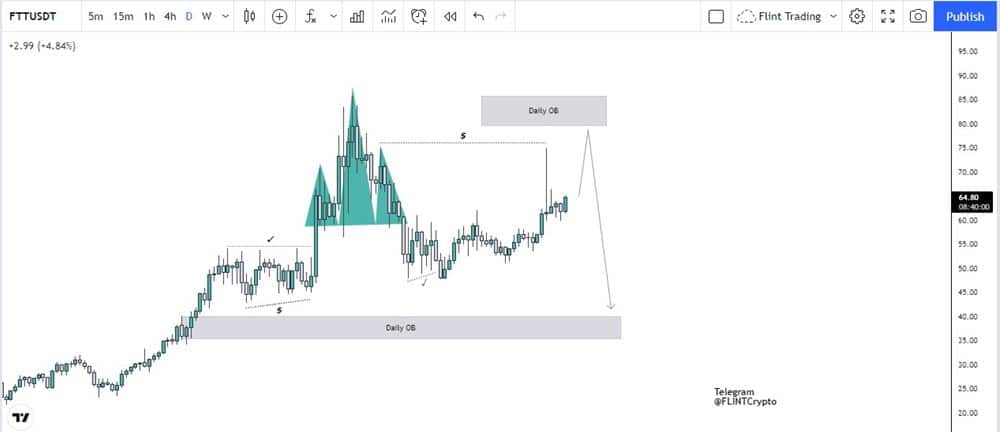
At the time of writing, FTT is being traded at the price of $64.82. The price has increased by almost 5.39% in the past 24 hours. FTT has created its all-time high around the price of $85.744 in September 2021. The daily trading volume of FTT has increased by almost 52.43% in a single day. FTT is listed on coinmarketcap on the 27th spot and has a market dominance of about 0.30%.
Top 5 Tech Stocks to Buy in 2024
Don't let the chaos of rising interest rates, potential recession, tighter credit issues, higher oil prices, and incessant geopolitical issues chase you from the markets. Instead, just wait it out. With too much fear in the market, go bargain hunting with tech stocks. We have complied a report with the five of the best ways to profit within this industry.
"Top 5 AI Stocks to Buy in 2024."
Click here to sign up for our free report & newsletter, plus bonus offer "Elon Musk just Tiggered a BOOM in These Stocks"
Sponsored
Technical Analysis FTT:
FTT is very much bullish on the monthly time frame. For the past 4 months, the market has been printing bullish candles. Previous month, the coin was able to break its previous high and made its new all-time high. Even though the price rejected to quite an extent but this month, the price is rallying up now. Now, this doesn’t mean that if the price is bullish, shorts are not possible. Definitely, shorts are possible as the price just can’t go up without doing retracements or corrections. So if possible structure shifts are observed at lower times, shorts can be taken. Now FTT on monthly can be considered as much extended and after its new all-time high, possible new Lower High can be expected.
Moving to weekly, the price the previous week again rejected the level of $75.19. these rejections shows that sellers are very much interested now around this area which may induce a bearish corrective move.
Jumping to the daily time frame for further clarity, It can be seen that, when price made its all-time high, it did through a head and shoulder pattern. This did pushed the price to a much lower level but it was unable to mitigate the order block sitting at $39.92.

Talking about the recent price action, it created liquidity through its wick at $76.12. Now many early sellers might sell from this level, but being conservative, the price might take them first, tap in the above order block and then push downside to clear the liquidity as marked in the chart and mitigate the orderblock as mentioned previously.
Now an invalidation point will be if in case the price breaks above the all time high, possible new bias shall be implemented. and another scenario, if the price fails to go up to that zone, and pushed]s a downside to a level of $39.92, possible longs can be taken from that.

