At the time of writing Hedera Hashgraph (HBAR) is being traded at the price of $0.3866. The price has increased by a value of almost 5.91% in the past 24 hours. HBAR has created its All Time High on 16th September 2021 and reached a value of $0.5760. The daily trading volume has increased by almost 3.21% in one day. The total supply of HBAR is 50B HBAR. HBAR is listed on coinmarketcap at 38th spot and has a market dominance of 0.22%.
Top 5 Tech Stocks to Buy in 2024
Don't let the chaos of rising interest rates, potential recession, tighter credit issues, higher oil prices, and incessant geopolitical issues chase you from the markets. Instead, just wait it out. With too much fear in the market, go bargain hunting with tech stocks. We have complied a report with the five of the best ways to profit within this industry.
"Top 5 AI Stocks to Buy in 2024."
Click here to sign up for our free report & newsletter, plus bonus offer "Elon Musk just Tiggered a BOOM in These Stocks"
Sponsored
Technical Analysis HBAR:
Previous month, HBAR was able to make its all time high, but as soon as it reached the value, it rejected quite much which closed the monthly candle at $0.3372. This means along the wick, the sellers are very much active and likely to enter again. The price overall is quite bullish, but as being sellers rejecting the candles a possible reversal can be seen soon.
Moving to a weekly time frame, the price is kind of ranging at the moment, after that spike, and is in some sort of ascending correction which might induce sellers soon. As direction of the daily, not much too clear, so on 4 hour time frame, the price is showing interesting things.
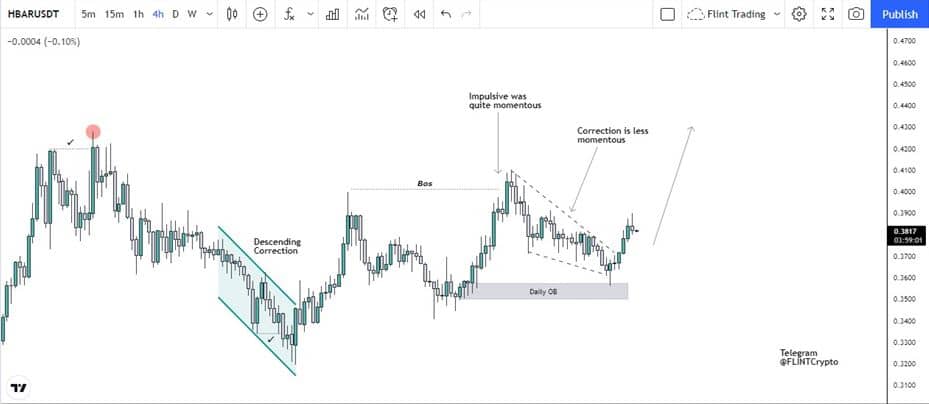
Structure wise of HBAR, the price is bullish, as on 12th of October, the first Lower high formed. The next lower High was confirmed at 18th of October, so now price being within this flow, it is likely that price where it is now, is potentially a new higher low to be formed.

Talking about Order block, the price recently, tapped in an order block form where ideally a reaction is to expected. now price rejected quite great from this zone. As being the price was in a descending triangle, the below wick might have taken below side liquidity, and now this move may take out upside liquidity.
Furthermore, the price when its making its Higher High, the candles are quite momentous, while when doing its correction, the momentum gets lost as its approaching the 61 or 75 level of Fibo. The target can be $0.4303 as a supply zone is present there, while an invalidation point is around $0.3445 as the Low will get broken, as structure would be bearish that way.

