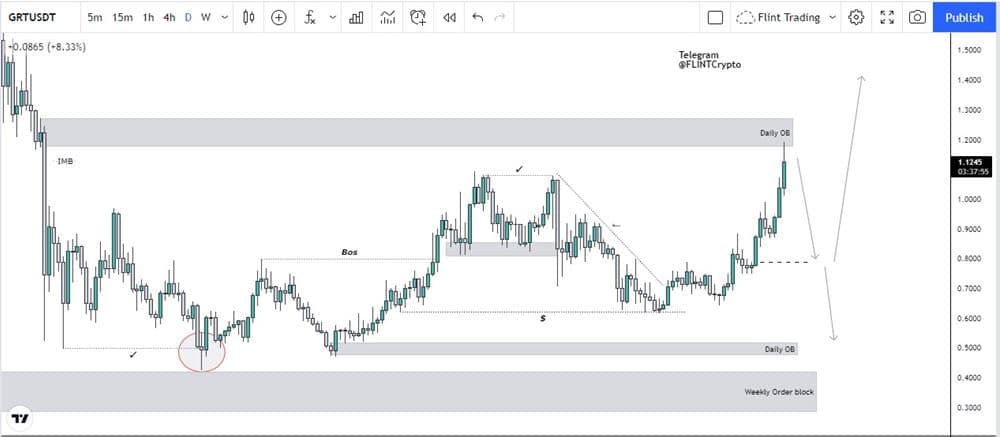
At the time of writing, GRT is being traded at the price of $1.12. The price has increased almost by 9.48% in the past 24 hours. The daily trading volume has decreased by almost 6.27%. GRT is listed on coinmarketcap on the 39th spot and has a market dominance of about 0.20%.
Top 5 Tech Stocks to Buy in 2024
Don't let the chaos of rising interest rates, potential recession, tighter credit issues, higher oil prices, and incessant geopolitical issues chase you from the markets. Instead, just wait it out. With too much fear in the market, go bargain hunting with tech stocks. We have complied a report with the five of the best ways to profit within this industry.
"Top 5 AI Stocks to Buy in 2024."
Click here to sign up for our free report & newsletter, plus bonus offer "Elon Musk just Tiggered a BOOM in These Stocks"
Sponsored
Technical Analysis The Graph (GRT):
Starting as usual from the monthly, the price of GRT is very similar to most of the other coins. The price made its new all-time high, did a correction, and now anticipating this to be the new lower high. Understanding the anatomy and story of candles, as this month being closing as a bullish engulfing, so it is likely that in the start of next month, the price might retest or wick in the 50% of this bullish engulfing, making price healthy which may push the price upwards in a longer-term.
Moving to the weekly time frame, the price is now within the weekly order block. Ideally, GRT should show us a reaction from the order blocks from a little to a much larger extent, depending on how price delivers within the range and if the price gets rejected and shows structure shifts. Jumping to the last time frame as usual which is daily to get the idea of recent price action and looking for Wyckoff, Elliot, or supply demand confluences.

As on the daily time frame, the price within the weekly orderblock has also tested the daily orderblock which is also a drop base drop pattern of the supply zone. The price when tapped in got rejected much and it can be expected that after some consolidation the price might push down to $0.7888 as a daily orderblock is sitting there.
Just before the price tapped in this orderblock, the price actually induced liquidity which through this wave got grabbed so now the market has the fuel needed to rally in either direction. Now talking about either side, sell-side is of high probability, as higher time frames directional bias aligns with it, moreover the weekly and daily orderblock might be a sort of an obstacle for price. Moreover, if this wasn’t enough, there’s some liquidity present at $0.6247 which might get grabbed, and just below that, there are two unmitigated order blocks which might drive price downside. But ideally, the first target is at $0.7888 and further direction will depends on how the price delivers within that zone.

