Technical Analysis:
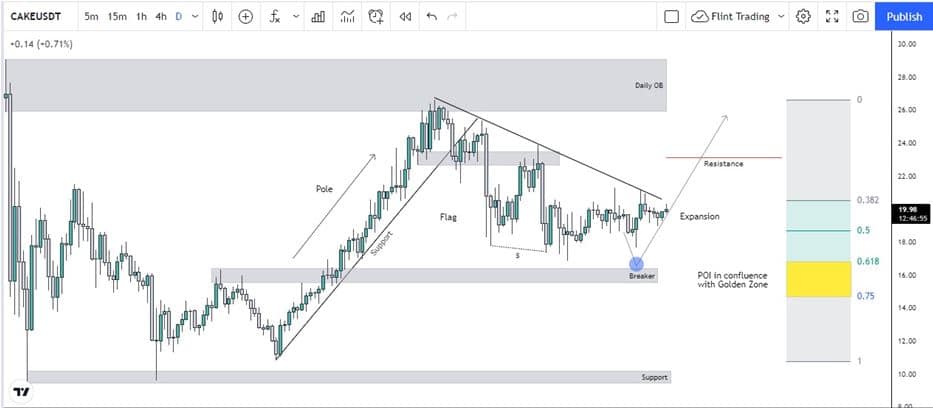
Most of the altcoins are somewhat coupled with the movement of btc. As a result, a lot of them follow similar paths whose project is strong. For this reason, the higher time frame of each alt is very much similar.
Top 5 Tech Stocks to Buy in 2024
Don't let the chaos of rising interest rates, potential recession, tighter credit issues, higher oil prices, and incessant geopolitical issues chase you from the markets. Instead, just wait it out. With too much fear in the market, go bargain hunting with tech stocks. We have complied a report with the five of the best ways to profit within this industry.
"Top 5 AI Stocks to Buy in 2024."
Click here to sign up for our free report & newsletter, plus bonus offer "Elon Musk just Tiggered a BOOM in These Stocks"
Sponsored
Theta on the monthly time frame shows that, after the impulsive bullish leg, the price went in a corrective phase, which actually tapped the zone between 50% to 61% of Fibonacci. Now price is showing some bullish evidence at this point which may push the price upside, which may last till the new Higher High in case if btc remains bullish.
On the weekly time frame, the structure to the downside is still intact, but a shift in structure is being observed, as the price recently around 19th July, tapped within the demand zone, and as anticipating, the price is showing some reaction of it.

Moving to the daily time frame, the price on a bigger picture is ranging but even within this range, the price shows us entries and positions which can be tradable. Talking about the price action within this range, the price first actually took out liquidity on the 20th of July 2021, and after that continuous bullish candles were printed but this didn’t last long as price went into a re-accumulating phase, it did a fake-out/ manipulated phase, and then the distribution or you can say the real move occurred to the downside. Now the initial of this was quite rapid, which left a bit of imbalance, which can drive the price higher.
Now before that unfolds, the price might retrace back a little as what can drive price higher can also drive price lower, as there’s bit of imbalance below as well. Along with it, there’s some liquidity as well, so ideally price might grab that, fill the imbalance, tap in the daily order block and then shoot up to that resistance level where stop losses are sitting.
Price Movement
At the time of writing, Theta is being traded at the price of $6.45. The price has decreased by 5% in the past 24 hours. Theta is listed on coinmarketcap at the 33rd spot and has a market dominance of about 0.25%. Theta went on to create it’s all-time high, around the price of $15.93 during the month of April 2021.

