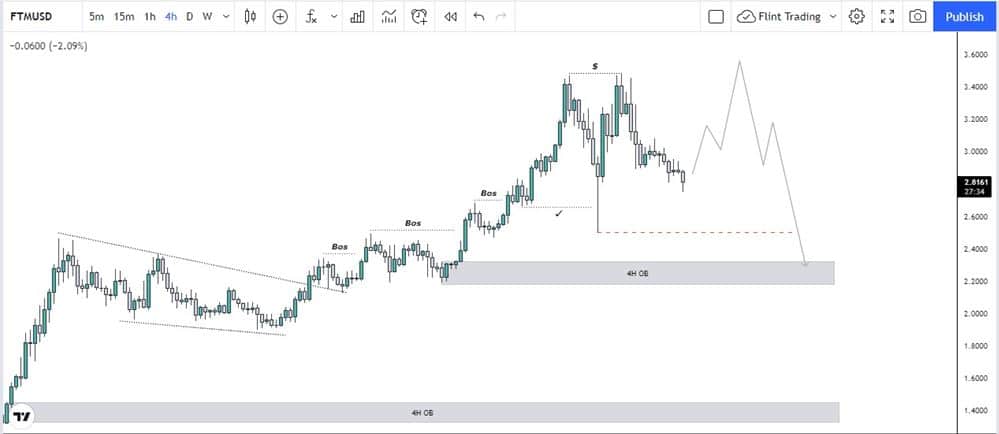
FTM being ranked at number #30 according to coinmarketcap data is being traded at around $2.73 at the moment. The coin has had a decrease of almost 9.16% within the last 24 hours. The high within this the price reached was $3.02 and the low was marked at $2.72
Top 5 Tech Stocks to Buy in 2024
Don't let the chaos of rising interest rates, potential recession, tighter credit issues, higher oil prices, and incessant geopolitical issues chase you from the markets. Instead, just wait it out. With too much fear in the market, go bargain hunting with tech stocks. We have complied a report with the five of the best ways to profit within this industry.
"Top 5 AI Stocks to Buy in 2024."
Click here to sign up for our free report & newsletter, plus bonus offer "Elon Musk just Tiggered a BOOM in These Stocks"
Sponsored
The coin has a trading volume of around $609,772,310 with a decrease of almost 50.60% in the last 24hours. The Circulating supply is now equal to 2.55B FTM.
FTM reached its all-time high in October where it gained a figure of $3.6894. This month an increase of 127% has been observed and is expected to increase further in the coming months
The top exchanges for trading in Fantom are currently Binance, Mandala Exchange, OKEx, FTX, and KuCoin
Technical Analysis FTM:
FTM is extremely bullish on the monthly time frame where for the last 3 months price has been creating consecutive bullish candles gaining 180.63%, 67.38%, and 131.56% which is just enormous.
Now obviously what goes up comes down for the correction, so it is very likely that the price might soon fall
Moving to the weekly, a clear re-accumulation of FTM was seen in the range of $1.4888 to $1.0898. Both legs are equal and it can be considered as a pole flag pattern. As the weekly candle is a pinbar with a huge rejection, it gives another possibility of a sniper move from here.
Jumping to the daily, the price is very much exhausted now as wicks are being seen both ways, and recently when getting rejected from topside, FTM has printed bearish candles for the past 4 days. Now as the price action is still not very clear on a daily, moving a bit lower is always a good idea. So moving to the 4 hours to get an idea about recent price action.

it can be seen that price was breaking structures to the top side for few times but recently it has shifted its structure and momentum to the downside. But it can be seen, this was done through a double top which has left liquidity on the top which might get cleared before falling more. So according to smart money, a turtle soup pattern or a stop hunt should occur which takes all the stop losses of traders who are shorting and then began its original move to the downside.
There is also an order block on the 4H time frame at $2.3106 which is unmitigated till date. It is very likely that it might mitigate that in the upcoming days.


