
Uniswap was developed in November 2018 by Hayden Adams which came to facilitate automated trading of decentralized tokens.
Top 5 Tech Stocks to Buy in 2024
Don't let the chaos of rising interest rates, potential recession, tighter credit issues, higher oil prices, and incessant geopolitical issues chase you from the markets. Instead, just wait it out. With too much fear in the market, go bargain hunting with tech stocks. We have complied a report with the five of the best ways to profit within this industry.
"Top 5 AI Stocks to Buy in 2024."
Click here to sign up for our free report & newsletter, plus bonus offer "Elon Musk just Tiggered a BOOM in These Stocks"
Sponsored
Uniswap keeps trading automated and fully open to anyone who is holding tokens. By automating the process, the protocol limits risk and reduce the risk for all parties. This year this token has gained value and fame due to defi and the associated surge in token trading.
Uniswap is considered as number 11 in ranking and now is being traded at the rate of $25.77 with an increase of 0.59% within the last 24 hours. not so great growth within the last few hours as the market was in a bearish correction but now can expect an increase in value in the upcoming days.
The total volume is around $15,754,054,778 and with a market cap $15,754,054,778. The circulating supply of this coin is around 611,643,723.83 UNI which is around 61% of the max supply.
The coin made its all-time in May 2021 where it reached a price of $45.00.
Technical analysis:
From the monthly to the daily, the coin as many other coins is bullish. Just like cake, the monthly shows an inside bar which is mitigating the previous engulfing candle, and similarly, on weekly, the coin is printing a pole flag pattern. Moving down to the daily, the price recent price action is quite impressive. The pole move ended just below the supply zone. The reversal took place through a known pattern called the double top which was quite clear as its both tops were equal.
This shows that much of the retail traders got into it giving a hint that much stop losses have been placed above that which might get grabbed sooner or later of maybe in the current impulsive move which we expect.
This with the confluence of the above supply zone indicates that price might be drove higher by these.
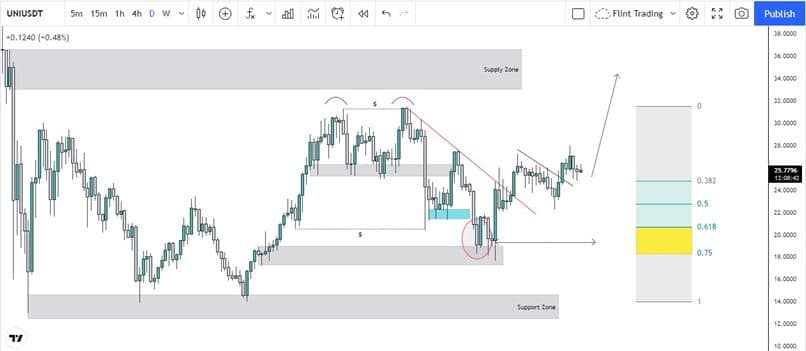
Now recently as marked in the chart, the price first broke the trendline to the upside, by being conservative, a bullish correction breakout must be observed before entering which recently it did with quite a good momentum. Now this in confluence with the expansion phase of pole flag with high momentum shows that price might continue to the upside to grab that liquidity and eventually taps in the supply zone.
Now talking above invalidation, the correction trendline is more of a support for price and in case if this trendline doesn’t hold the price, its very likely that price will go all the way down to $12.4372 to grab the liquidity resting below that support.