At the time of writing Litecoin (LTC) is being traded at the price of $200. The price has increased by almost 8.10% in the past 24 hours. The volume has decreased by almost 6%. LTC is listed at the 14th spot according to the marketcap and has a dominance of 0.52%.
Top 5 Tech Stocks to Buy in 2024
Don't let the chaos of rising interest rates, potential recession, tighter credit issues, higher oil prices, and incessant geopolitical issues chase you from the markets. Instead, just wait it out. With too much fear in the market, go bargain hunting with tech stocks. We have complied a report with the five of the best ways to profit within this industry.
"Top 5 AI Stocks to Buy in 2024."
Click here to sign up for our free report & newsletter, plus bonus offer "Elon Musk just Tiggered a BOOM in These Stocks"
Sponsored
Technical Analysis:
Starting from the monthly, the price is quite different to what a normal coin is. A crystal clear double bottom can be observed which took the price much higher recently. Now price is almost at the neckline of this pattern which gives an idea that it may continue up from here.
Jumping to the weekly, it looks like that LTC is almost done with the correction of the impulsive leg which made the all time high of this candle. Now on the daily timeframe, the price action is quite clear at the moment.
The price of LTC after making a head and shoulder fell off. but as to trap the majority of traders, its likely that the market instead of continuing down will now continue to the upside. Within the correction wave, the market at one point fell with much volatility which created a supply zone and an imbalance within the candle of 19th May.
These 2 confluence can drive the price to the higher side, as the orders lying in the supply zone needs to get mitigated in order for the price to remain healthy.
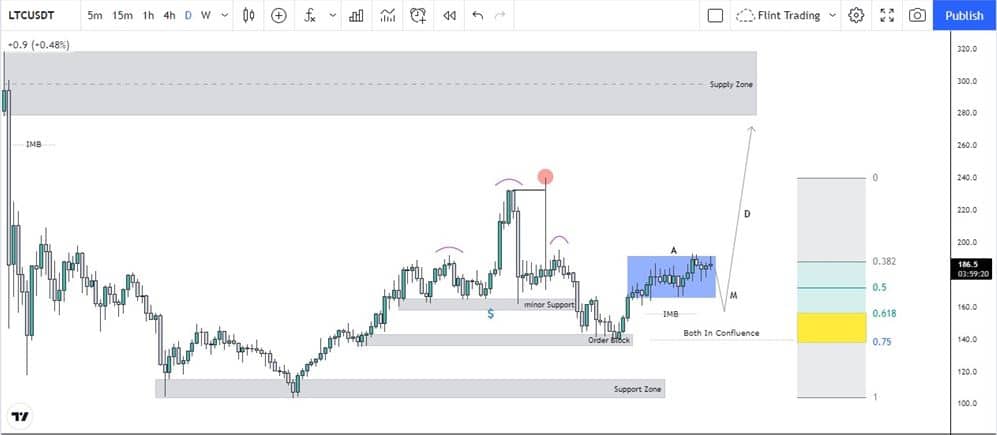
Now recently from the right shoulder, when the price started falling, it ended at the orderblock which pushed it to the upside because this zone was in confluence with the golden ratio of the Fibonacci, and just before price tapped into the orderblock, the market grabbed the liquidity which was being engineered for long a time before for almost a month.
Now talking about the extreme recent price action, the market seems to be in a phase of consolidation. This can be called as an accumulation of prices. Now as liquidity is present on both sides, and as imbalance is present below the range, it is quite likely that phase 2 of AMD i.e. Manipulation will occur to the downside which will fill the imbalance which can trigger the buyers into the market which eventually will push the price to the upside.