
At the time of writing Matic is being traded at the price of $1.52 with an increase of 0.82% in the past 24 hours. It is listed at the 21st spot on coinmarketcap with a market dominance of 0.41%. Matic had created its all time around price of $2.70 during the month of May 2021.
Top 5 Tech Stocks to Buy in 2024
Don't let the chaos of rising interest rates, potential recession, tighter credit issues, higher oil prices, and incessant geopolitical issues chase you from the markets. Instead, just wait it out. With too much fear in the market, go bargain hunting with tech stocks. We have complied a report with the five of the best ways to profit within this industry.
"Top 5 AI Stocks to Buy in 2024."
Click here to sign up for our free report & newsletter, plus bonus offer "Elon Musk just Tiggered a BOOM in These Stocks"
Sponsored
Technical Analysis:
Matic has been extremely bullish on the monthly timeframe. after the impulsive move, a correction occurred, which did mitigated the 50% but was soon rejected by the 50% of that move and now is continuing to push upside.
This month most likely is going to close bullish with an engulfing pattern which shows a bullish sentiment. Coming to the weekly timeframe, Matic is in a range bound move, which is creating support and resistances. This still can be considered in a descending triangle. The breakout will show where the price is most likely to rally.
Moving to the daily timeframe, the shows quite footprints and much can be determined through the past behavior of price of Matic. Now as the price is fractal, meaning that things which are seen on bigger time frame can be seen in a lower timeframe as well within those things.
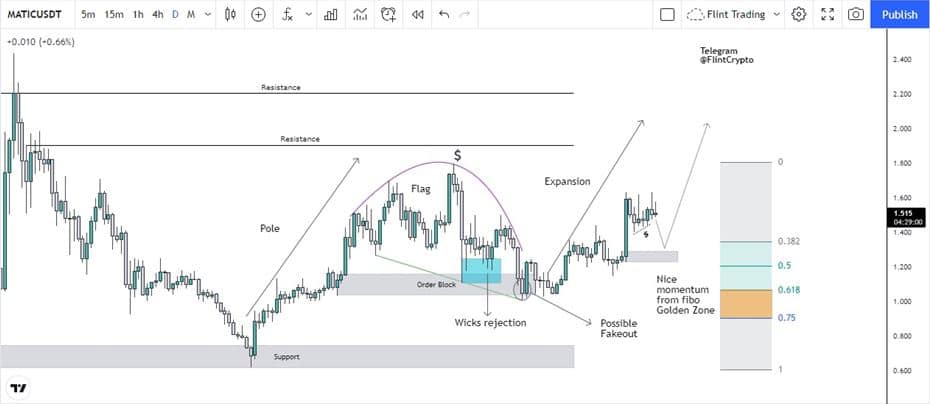
On a higher timeframe, a pole flag can be observed. The descending triangle can be considered as a flag of that pattern. So within that flag, another pole flag pattern can be seen on the daily timeframe. This originated from the level of $0.619 on the 20th of July 2021. This point induced quite much buyers into the market as it was a liquidity stop of level which was present at $0.753 on 23rd May.
Now unlike the higher time frame pattern, this pole flag pattern has almost unfolded, with much confluences to the upside. Price when came below the resistance level of $1.907. It has made a head and shoulder pattern and fell which was a flag pattern and as soon as it broke to the upside and completed Elliot triangular wave, it pushed upside.
Now, much retail would have jumped into it, which means that much stop loses are present to the upside. Now about the extreme price action, the market did pumped up in the expansion phase but it left an imbalance which price might target before continuing up. So it is likely that the price might retrace back to $1.517 and from there, an upside move can be expected.