
At the time of writing Stellar (XLM) is being traded at the price of $0.37. It has shown a decrease of about 1.69% in the past 24 hours. Stellar is listed on coinmarketcap at the 22nd spot and has a market dominance of 0.36%. XLM created its all-time high during the month of May 2021 and reached a price of $0.7985.
Top 5 Tech Stocks to Buy in 2024
Don't let the chaos of rising interest rates, potential recession, tighter credit issues, higher oil prices, and incessant geopolitical issues chase you from the markets. Instead, just wait it out. With too much fear in the market, go bargain hunting with tech stocks. We have complied a report with the five of the best ways to profit within this industry.
"Top 5 AI Stocks to Buy in 2024."
Click here to sign up for our free report & newsletter, plus bonus offer "Elon Musk just Tiggered a BOOM in These Stocks"
Sponsored
Technical analysis (XLM):
Stellar (XLM) price over the course of a few months has gained enormous growth. As it can be seen the price was really at the bottom, 5-6 months of bulls took the coin to its all-time high and pushed it above $0.7.
On the monthly timeframe, the price action of XLM seems to be bullish, as the price has mitigated the equilibrium of Fibonacci so a new impulsive leg can be expected of this coin. On the weekly, it can be seen that, as soon as price hit all time high, it rapidly fell down to grab stop losses which were being placed along with the move of this leg. Within this, the price left a fair value gap which needs to be rebalanced by the price so it can drive the price to the upside. On the daily timeframe, very likely like all other alts, the price broke the first structure to the upside on the 7th of august which changes the structure to the upside. This shift in structure was influenced by the double bottom.
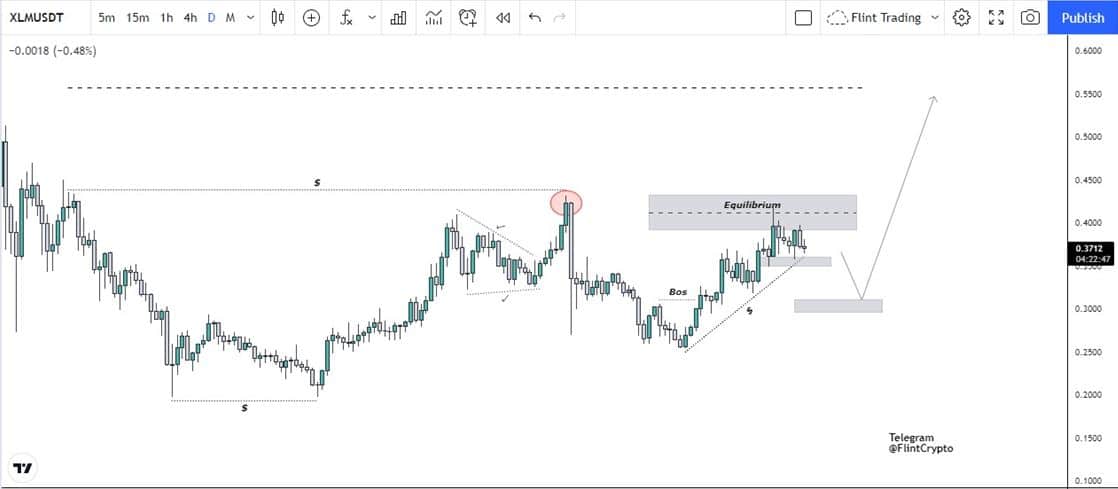
Now this obviously pushed price higher, but it did left some liquidity below which XLM may grab in the future, but it doesn’t seems to be happening nearby. Now this double bottom move lasted till the 6th of September, where the price reacted from an OB, but this OB was fully mitigated which creates some liquidity to the upside.
The creation of an equal high did took some liquidity beforehand which created a high volume of bears in the market which decreased 20% the price value in a day. Nevertheless, the price had recovered now and still is again testing that zone. Now in recent price action, as the market is in consolidation around the zone, it is likely that the demand might sooner fail the supply which will induce buyers to much extent.
But there are some areas below which might drive the price a bit lower which can unfold an AMD pattern as there’s liquidity and an unmitigated zone. So from there, possible longs can be taken if the LTF gives proper structure shifts.