
At the time of writing, TRX is being traded at the price of $0.09. The price of TRX has increased by just 0.26% in the past 24 hours meaning it is almost the same as the last day’s candle close. In the past day, the trading volume has almost decreased by 21.23%. On coinmarketcap, TRX is listed in the 30th spot and holds the dominance of 0.28% overall. Traders are quite bullish on TRX in long term and hoping that it would provide a good opportunity.
Top 5 Tech Stocks to Buy in 2024
Don't let the chaos of rising interest rates, potential recession, tighter credit issues, higher oil prices, and incessant geopolitical issues chase you from the markets. Instead, just wait it out. With too much fear in the market, go bargain hunting with tech stocks. We have complied a report with the five of the best ways to profit within this industry.
"Top 5 AI Stocks to Buy in 2024."
Click here to sign up for our free report & newsletter, plus bonus offer "Elon Musk just Tiggered a BOOM in These Stocks"
Sponsored
Technical Analysis:
Starting Tron (TRX) from the monthly, the price was bullish this month. Before this month, the candle closure was indecisive. But overall looking at the trend, the coin is very bullish. Checking the weekly time frame, it can be observed that the price to some extent was trying to retest the neckline of a double top, which it failed as the price delivered into that quite impulsively. Moving to a lower time frame, the daily is also showing the same sentiment.
The price of TRX this month has started pushing up and tapped in the supply zone, which took out liquidity which was induced previously. This tapping was not normal, as it did in a flow of the pattern. This pattern was a head and shoulder pattern. As mentioned above, on a higher time frame, the neckline of the double top wasn’t respected, neither this head and shoulder unfolded which it should have.
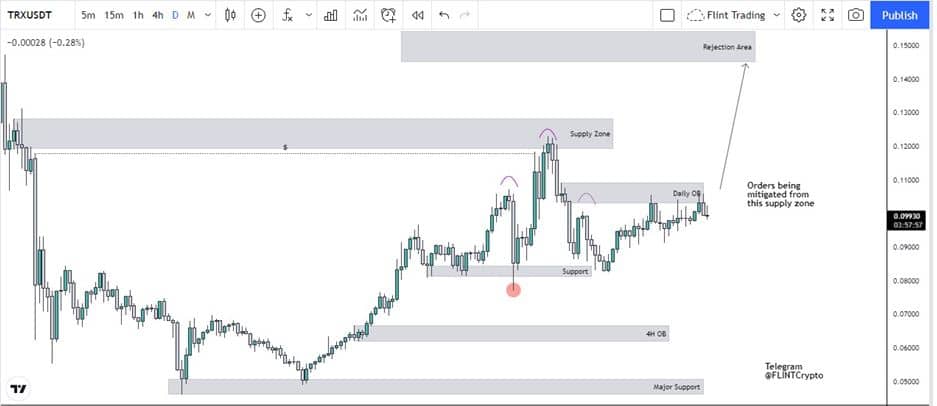
The right shoulder of this pattern, left a supply zone while pushing down, which for the past few days has been tested. Now the price has been continuously testing and consolidating around this supply zone, which shows that orders present within this zone are continuously being filled by the price eventually will fill all of them which will push TRX to the upside.
Talking about the downside, a stop hunt of support has already formed which shows that there is no reason for the price to drive downside. But talking about the probabilities, there are some unmitigated zones below which in the future can drive the price lower.
If this supply zone doesn’t hold, it is likely that the price might continue to the above rejection area as marked up in the chart. An invalidation point will be if case the market does respect this supply zone and violates the level of $0.08193